Excel is a powerful tool for managing personal finances. Its flexibility allows you to customize your budget, track expenses, and visualize your financial health. Here’s a step-by-step guide to setting up your finances in Excel:
1. Setting Up Your Spreadsheet
Start by opening a new Excel workbook. Create separate sheets for different aspects of your finances. A good starting point includes sheets for:
- Budget: Planning your income and expenses.
- Transactions: Recording every income and expense transaction.
- Summary: A high-level overview of your finances.
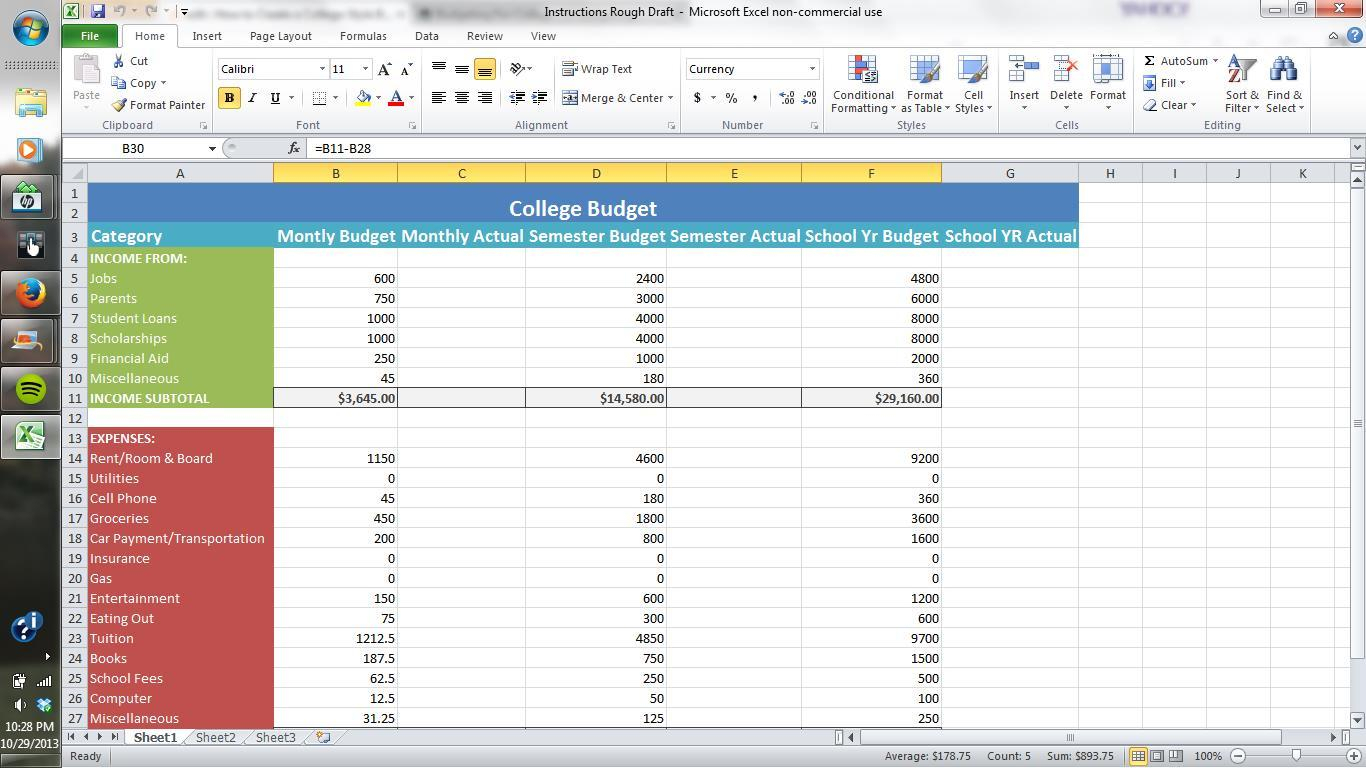
Within the “Budget” sheet, create columns for categories like “Income,” “Housing,” “Food,” “Transportation,” “Entertainment,” “Savings,” and “Debt Payments.” Add rows for each month of the year.
In the “Transactions” sheet, create columns for “Date,” “Description,” “Category,” “Amount,” and “Notes.” This sheet will be your central repository for all financial activity.
2. Creating Your Budget
In the “Budget” sheet, fill in your expected income for each month. Then, estimate your expenses for each category. Be realistic! It’s better to overestimate expenses than underestimate them.
Use Excel’s formula functionality to calculate totals. For example, to calculate the total expenses for a month, use the `SUM` function: `=SUM(B2:B10)`, assuming your expense categories are in rows 2 through 10 of column B.
Calculate the difference between your income and expenses to see your projected monthly surplus or deficit. This allows you to adjust your spending habits and allocate more money towards savings or debt repayment.
3. Tracking Your Transactions
The “Transactions” sheet is where you record every financial transaction. Be diligent about recording all income and expenses, categorizing them correctly. This is crucial for accurate tracking.
Use data validation (Data > Data Validation) in the “Category” column to create a dropdown list of your budget categories. This ensures consistency and reduces errors.
4. Summarizing Your Finances
In the “Summary” sheet, use formulas to pull data from the “Budget” and “Transactions” sheets. You can create formulas to:
- Calculate total income and expenses for a specific month or period.
- Compare budgeted vs. actual expenses.
- Track your savings rate.
- Monitor your debt repayment progress.
For example, to calculate the total actual spending on “Food” for January, you could use the `SUMIFS` function: `=SUMIFS(Transactions!D:D, Transactions!C:C, “Food”, Transactions!A:A, “>=2024-01-01”, Transactions!A:A, “<=2024-01-31")`. This formula sums the amounts (D:D) from the "Transactions" sheet where the category (C:C) is "Food" and the date (A:A) is within January 2024.
5. Visualizing Your Data
Excel’s charting tools can help you visualize your financial data. Create charts to:
- Compare your budgeted vs. actual spending across categories.
- Track your income and expenses over time.
- Visualize the growth of your savings.
Select the data you want to visualize, then go to Insert > Charts and choose the chart type that best represents your data (e.g., pie chart for expense distribution, line chart for tracking income over time).
By diligently tracking your finances in Excel, you can gain valuable insights into your spending habits, identify areas for improvement, and achieve your financial goals. Remember to review and update your spreadsheet regularly to ensure its accuracy and relevance.
 1366×768 setting excel spreadsheet finances db excelcom from db-excel.com
 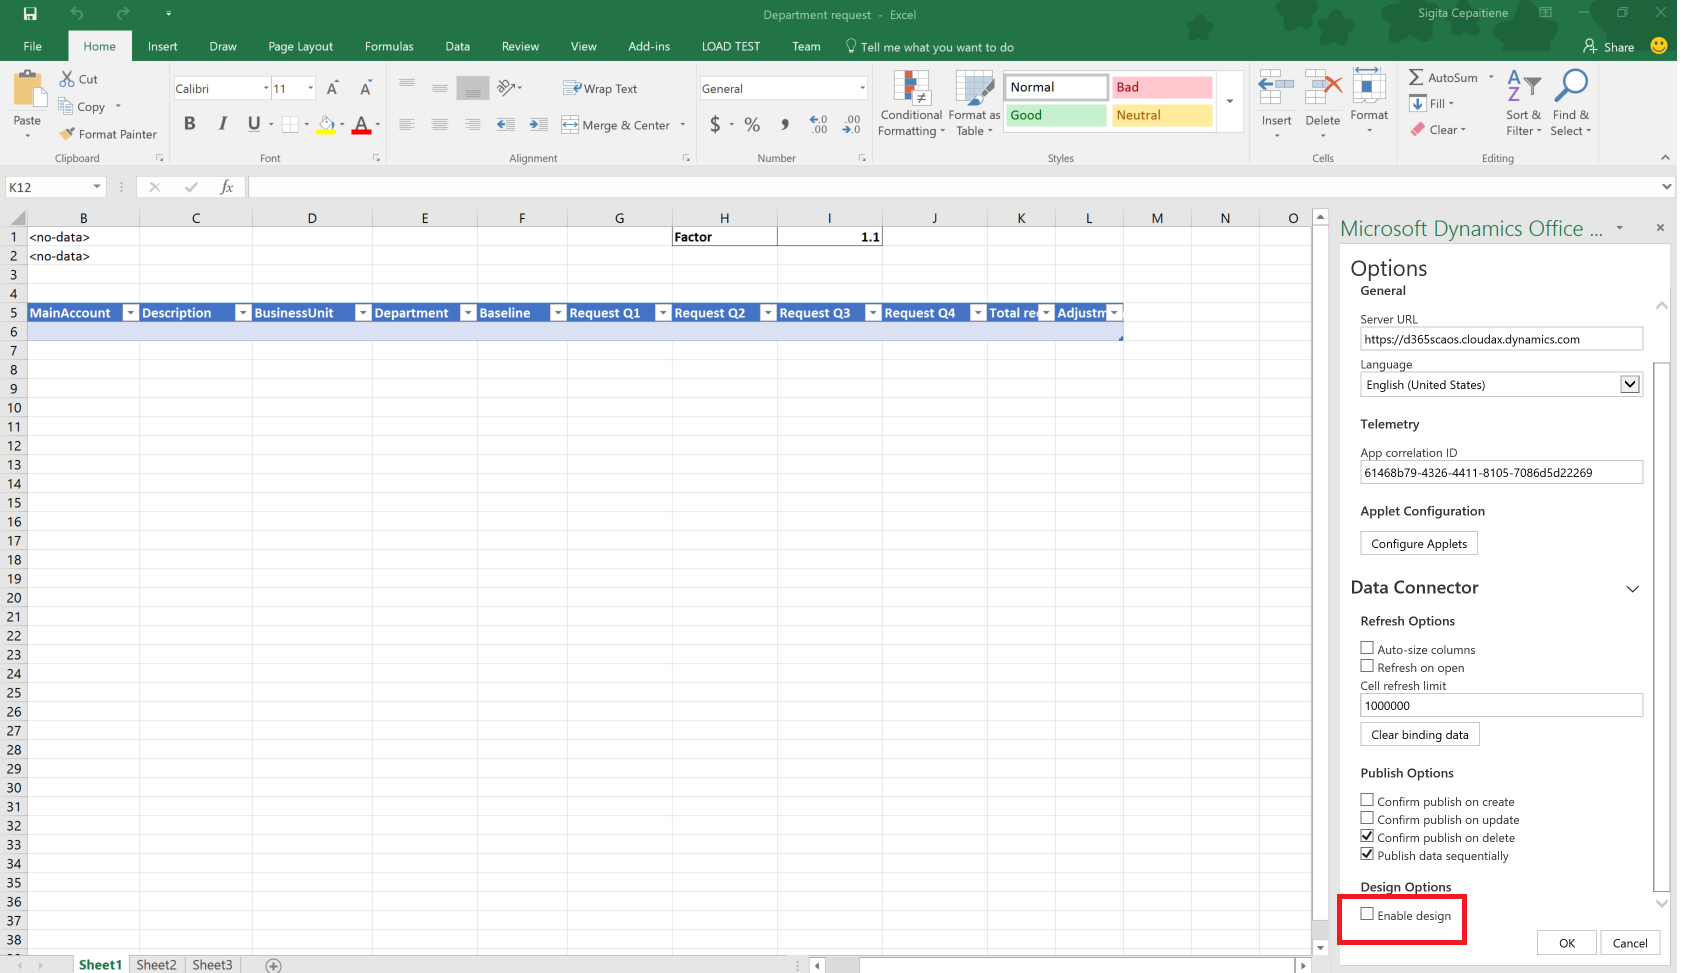 1683×973 setting excel spreadsheet finances spreadsheet downloa from db-excel.com
  1875×970 organize finances spreadsheet db excelcom from db-excel.com
  2048×1536 setting excel financial modelling from www.slideshare.net
  1280×772 financial spreadsheet personal finance spreadsheete sheet expenses from db-excel.com
  1200×850 excel finance formulas tips tricks exceldemy from www.exceldemy.com
  717×593 excel finance templates db excelcom from db-excel.com
  848×601 finance template excel exceldemy from www.exceldemy.com
  1280×600 finance excel spreadsheets excelxocom from excelxo.com
  569×290 excel formulas finance easy guide exceldemy from www.exceldemy.com
  1280×800 set financial spreadsheet excel household finance from db-excel.com
  1160×872 set financial spreadsheet excel personal from db-excel.com
  1785×826 top financial functions excel from www.makeuseof.com
 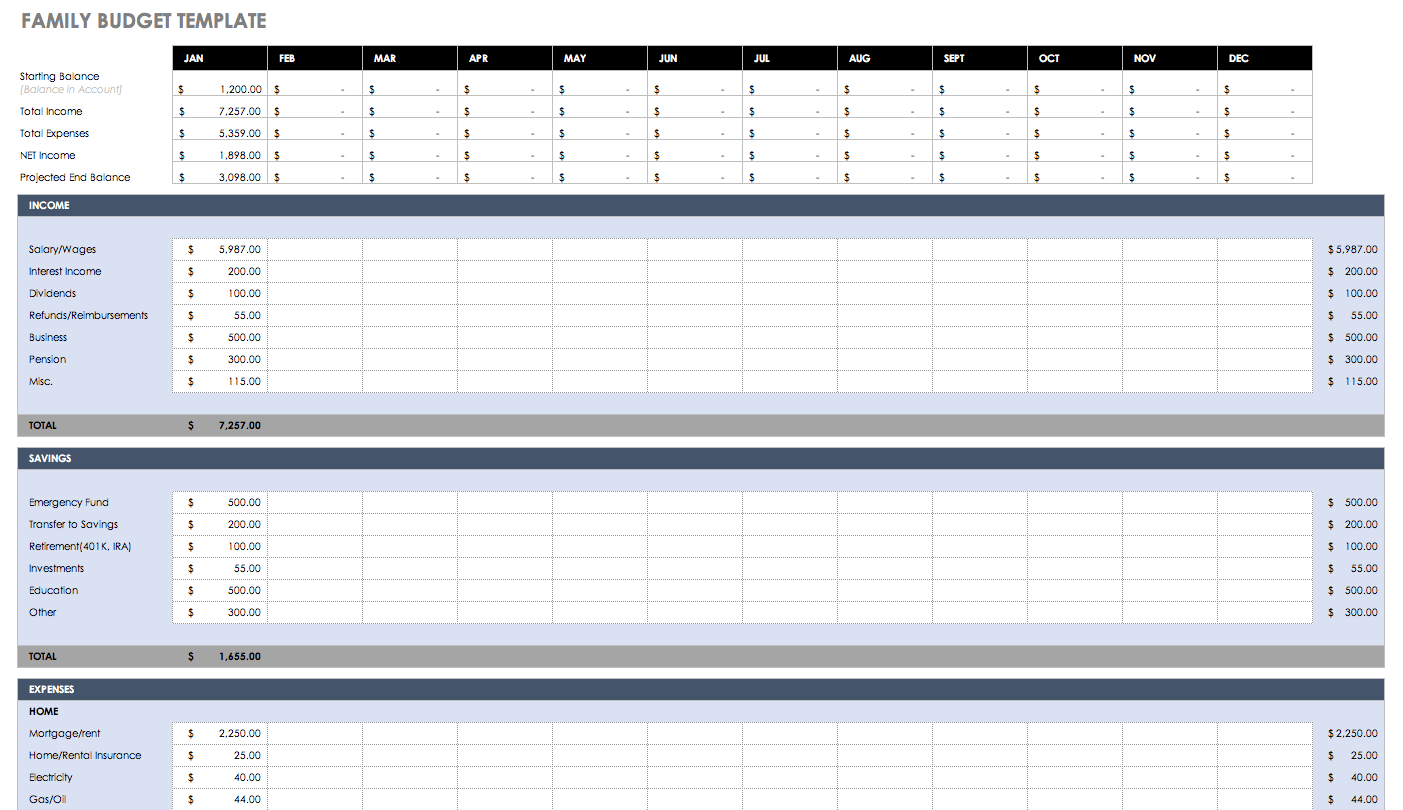 1403×810 set financial spreadsheet excel db excelcom from db-excel.com
  1919×1079 manage personal finances microsofts money excel from www.pcmag.com
 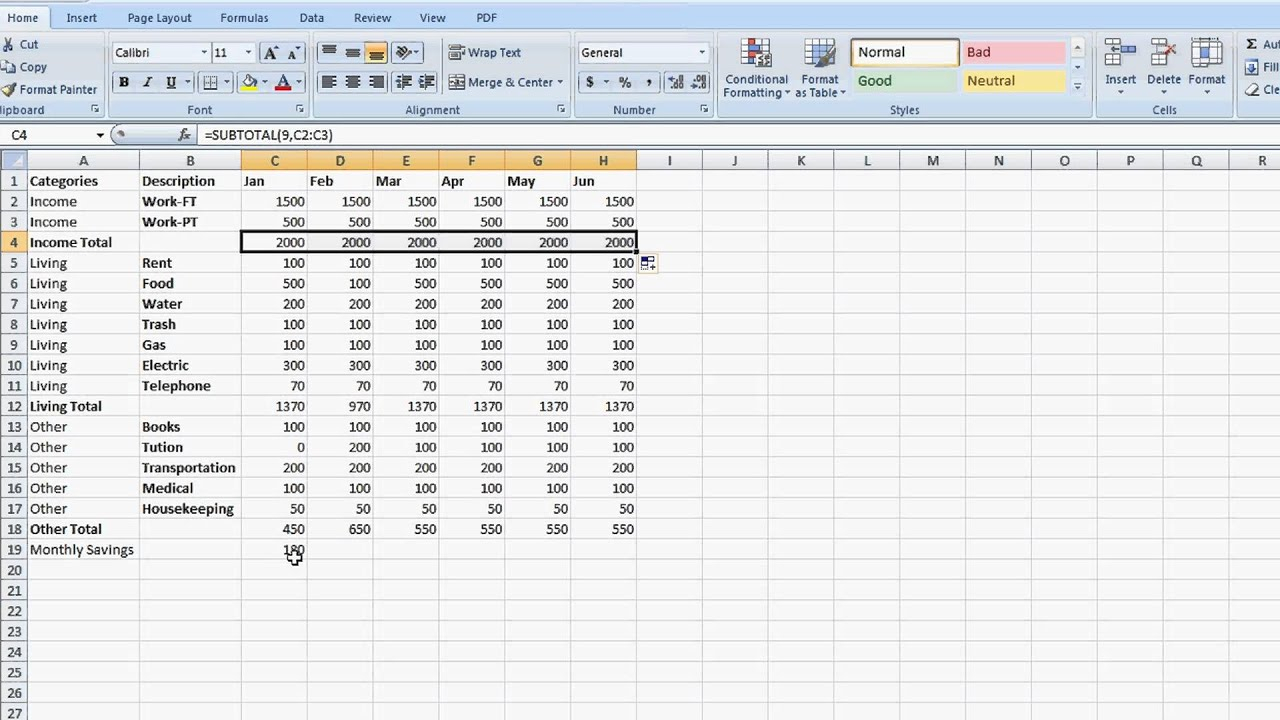 1280×720 set financial spreadsheet db excelcom from db-excel.com
  1280×720 financial planning excel spreadsheet db excelcom from db-excel.com
  1200×627 excel finance top excel formulas analysts from corporatefinanceinstitute.com
  640×480 finance excel from www.slideshare.net
640×480 finance excel from www.slideshare.net  1024×689 business finance management excel template adnia solutions from adniasolutions.com
  1024×993 essential excel templates finance adnia solutions from adniasolutions.com
  1200×627 excel finance top formulas functions from corporatefinanceinstitute.com
 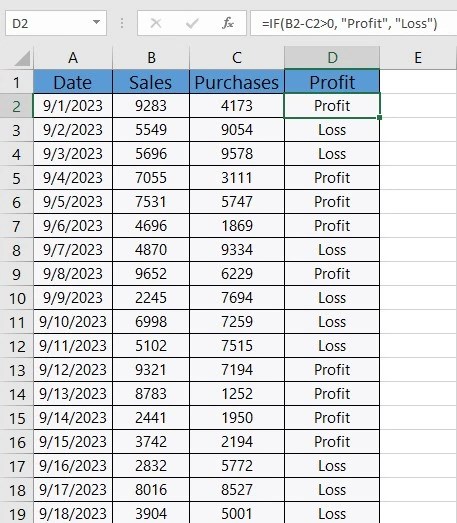 457×523 excel finance excel financial formulas cheat sheet from bsuite365.com
 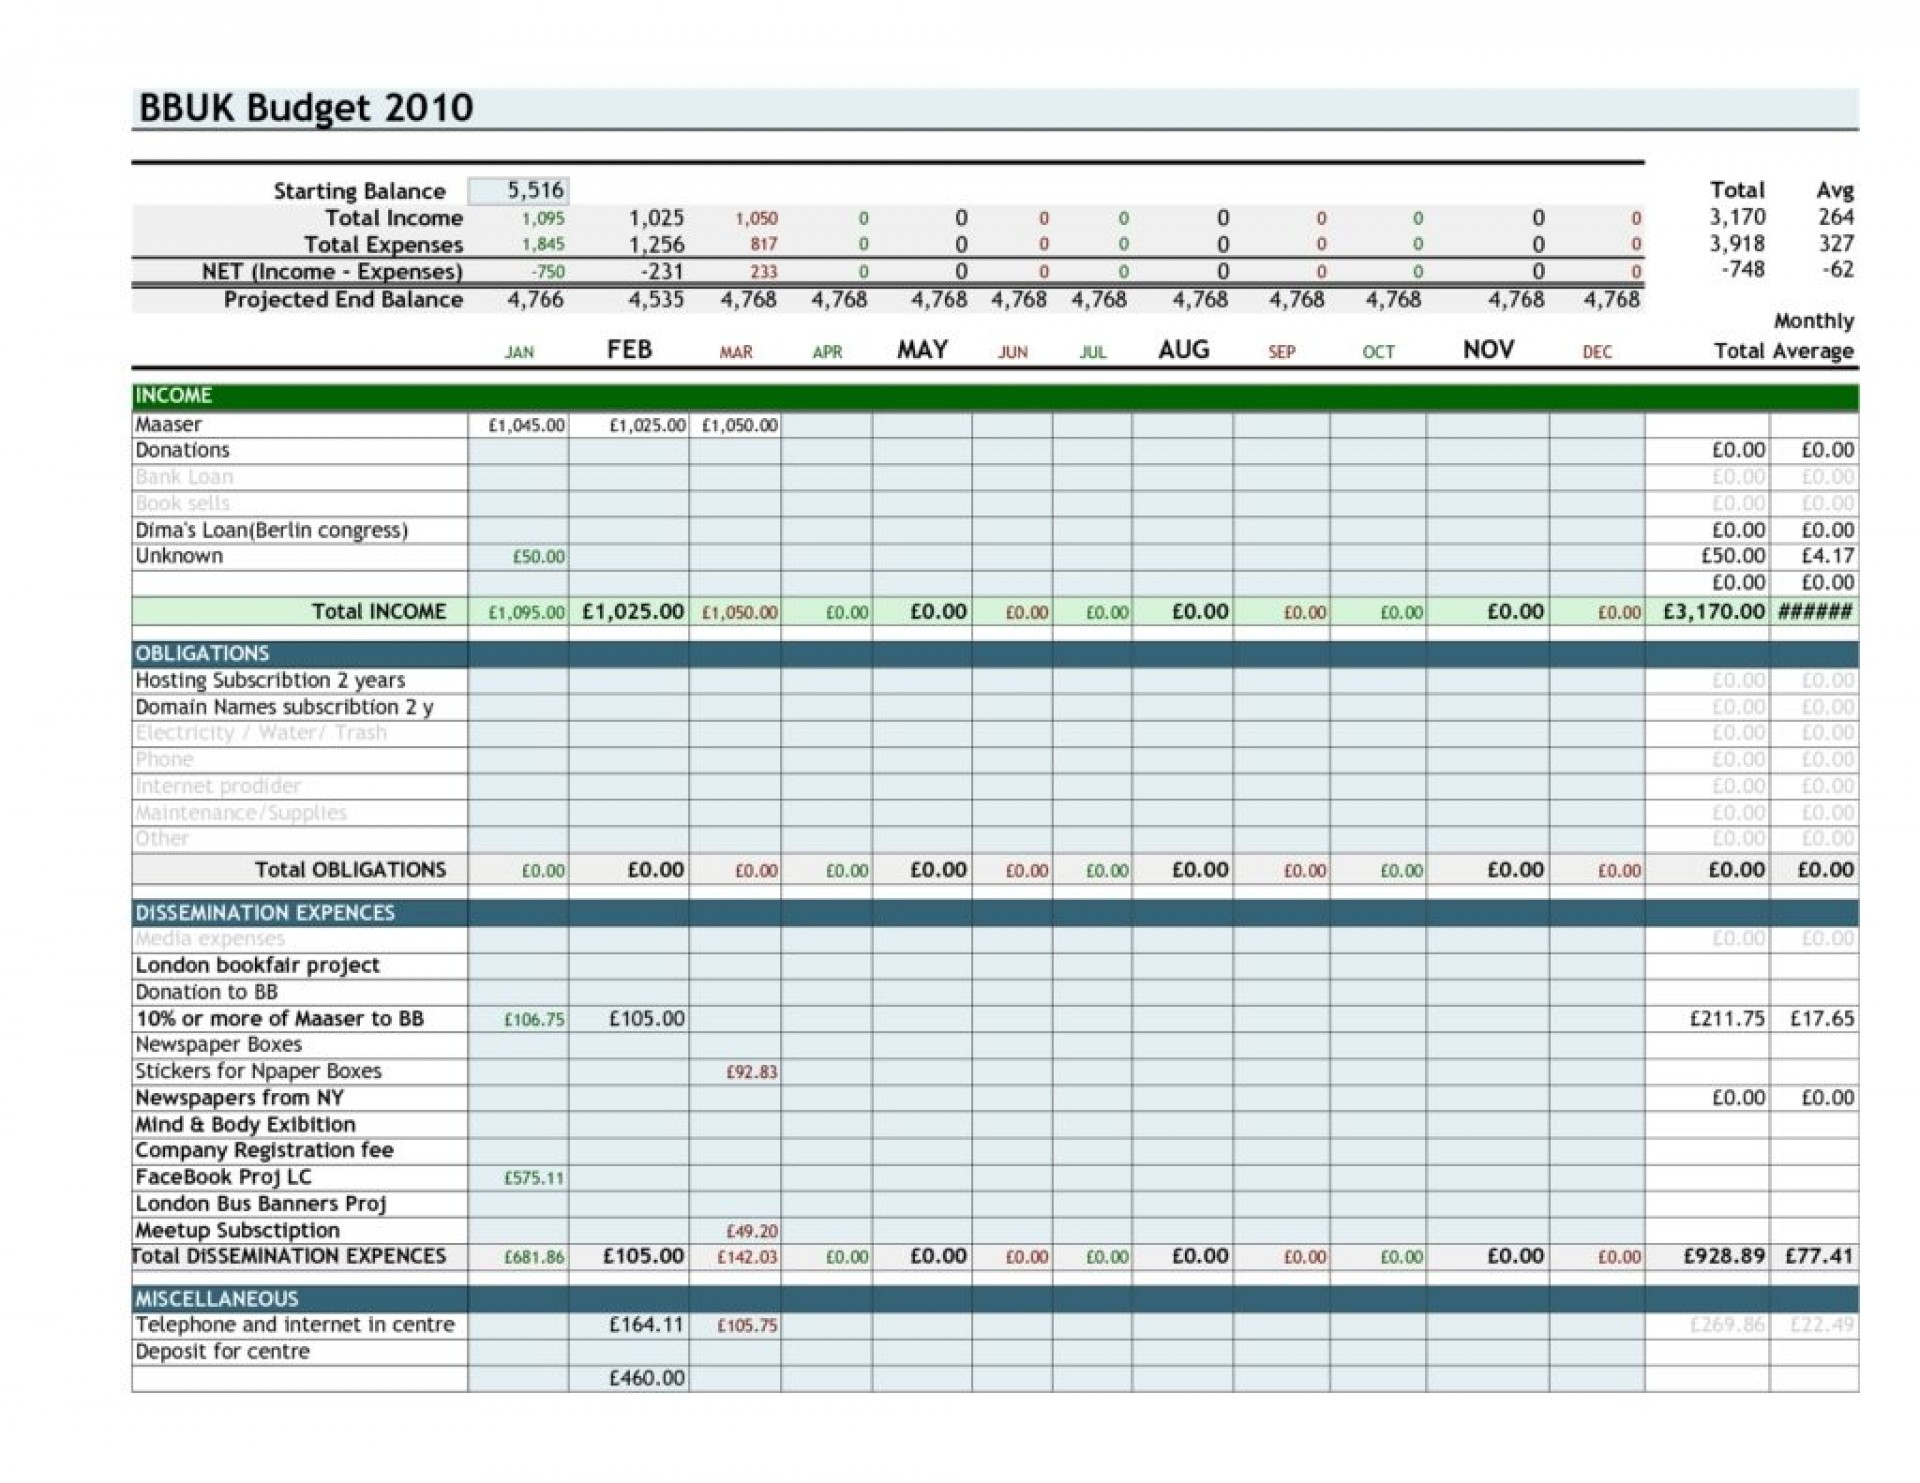 1920×1483 set financial spreadsheet set financial from db-excel.com
  750×450 excel finance guide finance career from www.financewalk.com