Yahoo Finance is a widely used platform for tracking financial data, offering real-time stock quotes, news, and analysis. Google Sheets, a popular spreadsheet application, can be linked to Yahoo Finance to automatically pull and update financial information, creating dynamic dashboards for investment tracking and analysis.
The primary method for pulling data from Yahoo Finance into Google Sheets is through the GOOGLEFINANCE function. This function allows you to retrieve current and historical information about stocks, currencies, mutual funds, and other securities. The basic syntax is =GOOGLEFINANCE("ticker", "attribute", "start_date", "end_date", "interval").
Ticker: This is the stock symbol or currency pair you want to track. For example, “AAPL” for Apple or “EURUSD” for the Euro/US Dollar exchange rate.
Attribute: This specifies the type of data you want to retrieve. Common attributes include:
- “price”: The current price.
- “high”: The highest price of the day.
- “low”: The lowest price of the day.
- “volume”: The trading volume.
- “marketcap”: The market capitalization.
- “pe_ratio”: The price-to-earnings ratio.
- “eps”: Earnings per share.
- “52weekhigh”: The 52-week high.
- “52weeklow”: The 52-week low.
- “date”: For historical data, the date.
- “close”: For historical data, the closing price.
Start_date and End_date: These are optional arguments used to retrieve historical data. If provided, the function returns a range of data between the specified dates.
Interval: This is also optional and specifies the frequency of historical data (e.g., “DAILY” or “WEEKLY”).
Examples:
- To get the current price of Apple stock, use:
=GOOGLEFINANCE("AAPL", "price") - To get the 52-week high of Google stock, use:
=GOOGLEFINANCE("GOOG", "52weekhigh") - To get historical closing prices of Microsoft stock for the last week, use:
=GOOGLEFINANCE("MSFT", "close", TODAY()-7, TODAY())
By combining the GOOGLEFINANCE function with other Google Sheets features, you can create sophisticated investment trackers. You can use conditional formatting to highlight stocks that meet certain criteria (e.g., stocks with a PE ratio below a certain threshold). You can also create charts to visualize historical price trends. Furthermore, you can use formulas to calculate portfolio performance, track dividends, and analyze investment returns.
It is important to note that the GOOGLEFINANCE function has limitations. The data may be delayed (typically up to 20 minutes), and the function is subject to rate limiting, meaning there’s a limit to how many requests you can make in a given period. Excessive use can result in errors. Also, the accuracy and availability of data are dependent on Google’s data sources and may vary. Always verify data accuracy with other reliable sources before making investment decisions.
In conclusion, integrating Yahoo Finance data into Google Sheets through the GOOGLEFINANCE function empowers users to build personalized and dynamic financial dashboards for tracking investments, conducting analysis, and making informed decisions.
 1338×750 google finance spreadsheet google finance data google from db-excel.com
  1263×964 yahoo finance spreadsheet db excelcom from db-excel.com
  809×407 automatically yahoo finance day stock price google from investmentmoats.com
  1570×758 google finance spreadsheet regard google finance update helps from db-excel.com
 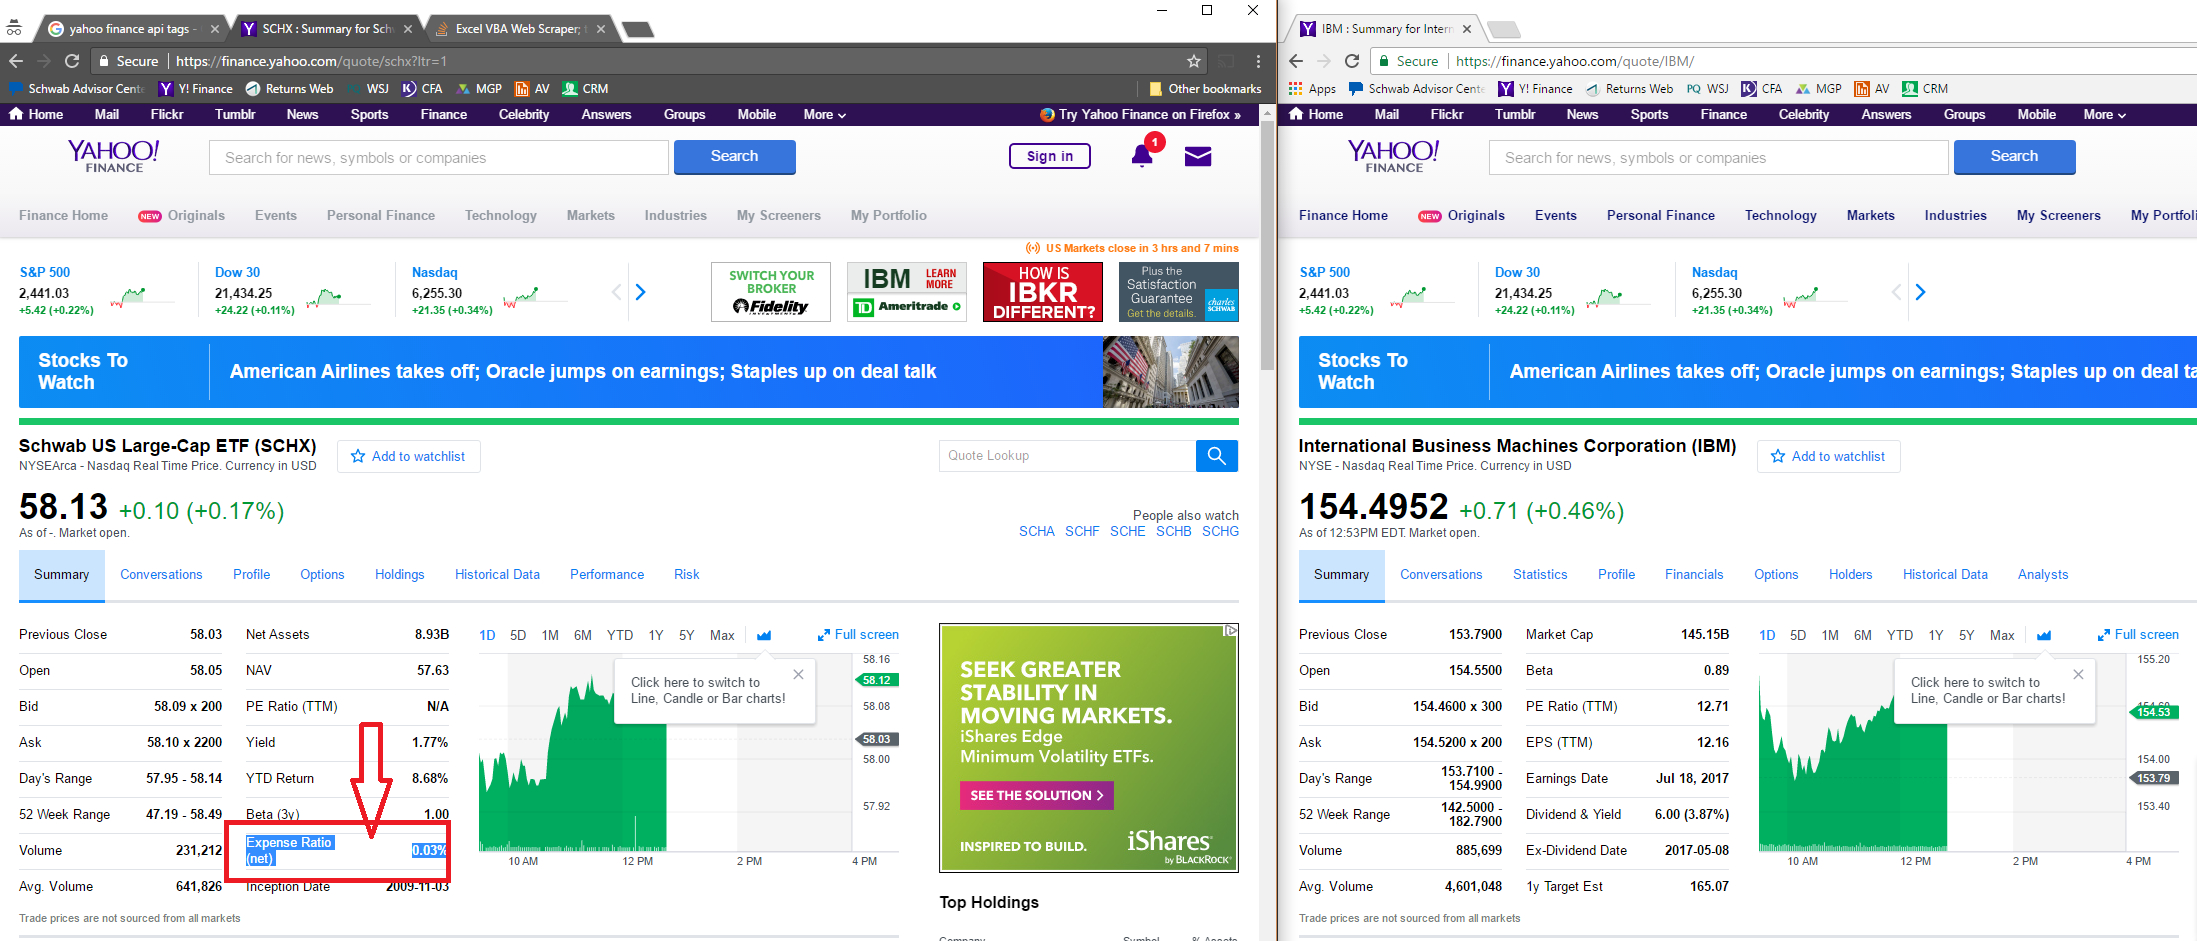 2197×941 yahoo finance spreadsheet google spreadshee yahoo finance google from db-excel.com
  2094×894 google finance spreadsheet template google spreadshee google from db-excel.com
  1368×876 yahoo finance spreadsheet pertaining historical data from db-excel.com
  1024×767 solution yahoo finance data refreshing google spreadsheet from investmentmoats.com